A smartphone displaying a financial chart with candlestick patterns is placed on a dark, crumpled fabric surface. The chart features various colored candlesticks against a dark background, suggesting financial analysis or stock market activity.

Insights

Explore our analytics and charts for informed stock market decisions.

A hand holding a smartphone displaying a colorful line graph with various candlestick patterns, indicative of financial or stock market data. The background consists of a textured, woven fabric surface in neutral tones.
A person holds a smartphone displaying a stock market trading app with candlestick charts. A laptop is on a wooden table with a similar financial chart, indicating active trading or analysis. The setting suggests a home office or casual workspace.
A hand holding a smartphone displaying a stock market chart with candlesticks and line graphs. In the background, there are blurred Christmas tree lights creating a festive ambiance.
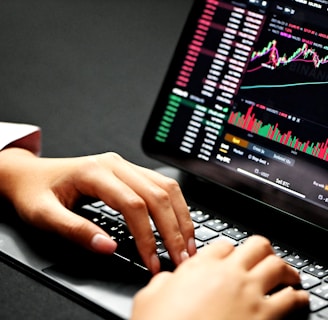
Hands typing on a laptop keyboard with a screen displaying financial graphs and stock market data. Multiple charts and numbers are visible, indicating online trading or financial analysis.
A laptop displays a financial trading platform with a candlestick chart showing stock market data. The chart is colorful, with blue and orange bars representing volume, and fluctuating lines indicating stock prices over time. Surrounding the laptop are two small potted plants on a white surface.

Market Insights

MKT Charts provides investors with critical analytics for stock movements.

A hand is holding a smartphone displaying a financial chart with fluctuations in orange lines. The background features blurred computer screens with a dark theme.
Stock Analysis Tools

Our tools empower investors to make informed decisions based on comprehensive market data and predictive analytics, ensuring they stay ahead of market trends and potential shifts in stock performance.

A person is using a smartphone to view a financial market chart. The screen displays a candlestick chart with green and red bars, likely indicating cryptocurrency or stock prices. The person appears to be seated, wearing casual clothes like shorts and holding the phone in both hands.
Investment Strategies

We develop tailored strategies that leverage our analytics, helping investors navigate the complexities of the stock market and optimize their investment portfolios for maximum returns.